Probabilistic Models of
Human and Machine Intelligence
CSCI 5822
Assignment 8
Assigned 4/5/18
Due 4/12/2018
Goal
The goal of this assignment is to give you a
first-hand appreciation of the Dirichlet process mixture
model. You will use the Chinese restaurant process for
computing probabilities and sampling.
Task 1
Make a graph showing the probability that a
new customer will be assigned to an empty table in the CRP, as a
function of the number of customers already in the restaurant.
For example, when there are 0 customers in the restaurant,
the next customer -- customer 1 -- will be assigned to a new
table with probability 1. Use α = 0.5, and plot your
graph for up to 500 customers.
Hint: If you're thinking about running a sampler, you should think again. You can compute this probability analytically.
Hint: If you're thinking about running a sampler, you should think again. You can compute this probability analytically.
Task 2
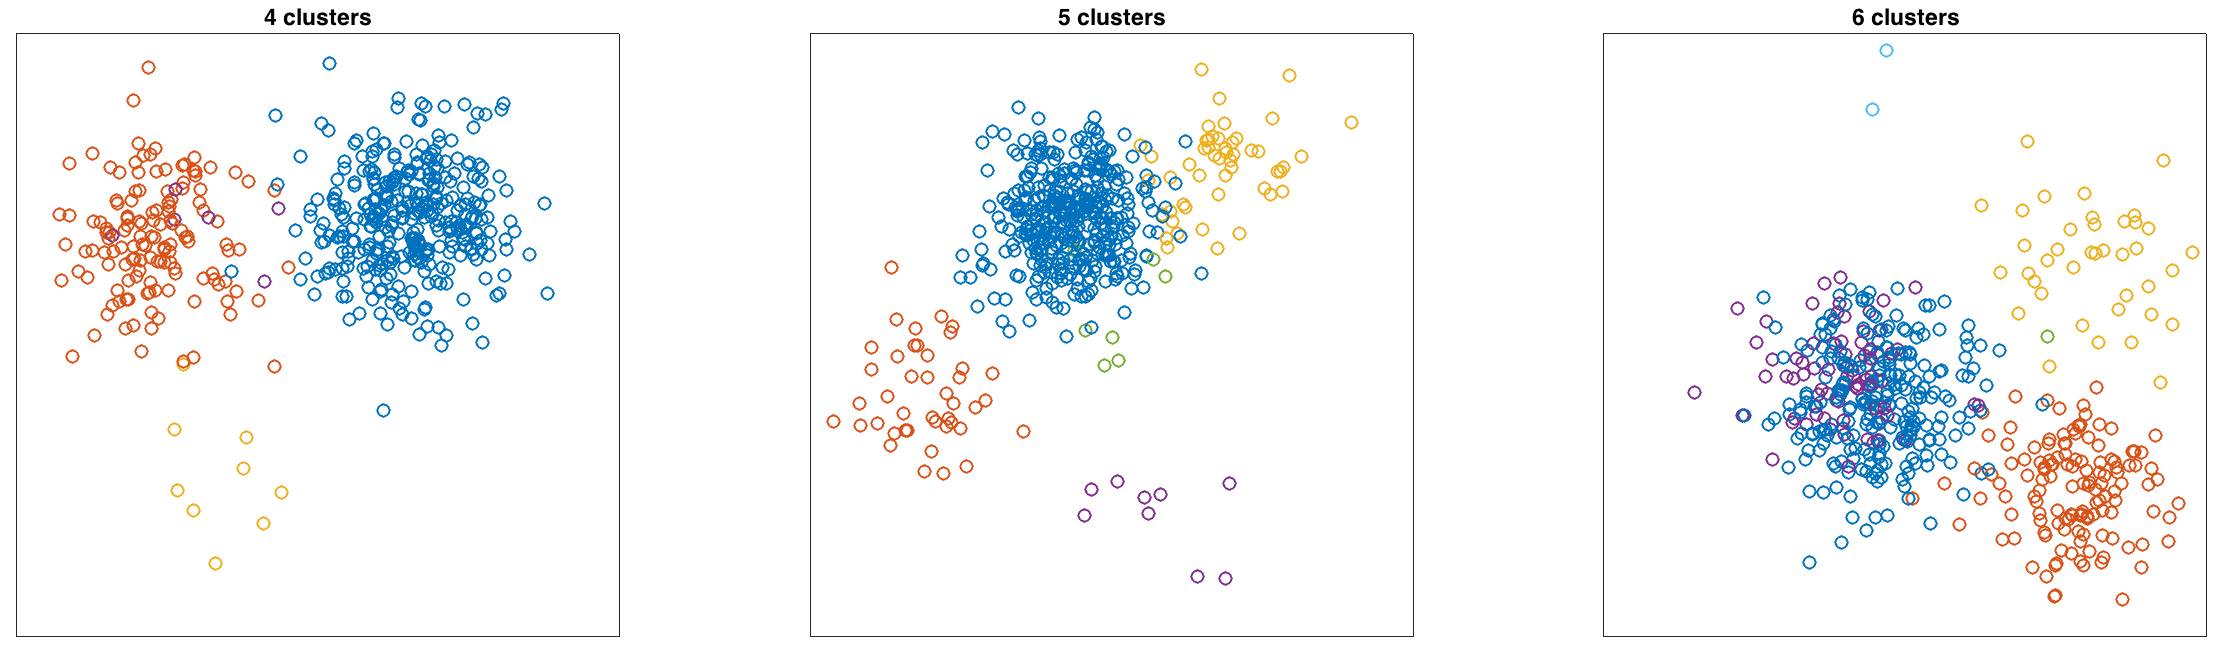
Using the CRP, draw samples from a Dirichlet
process mixture model with Gaussian components in a 2
dimensional observation space. For this draw, use α = 0.5 and G0
specifies the center of one Gaussian component. Define G0 =
(X,Y) with X ~ Uniform(0,1) and Y ~ Uniform(0,1). Use σ = 0.1
for all components. Plot some sample draws from the DPMM
with 500 points. Below are 3 examples that I generated. I color
coded the points to indicate the component that generated the
observation..
Task 3 [OPTIONAL]
If you are ambitious, write a Gibbs sampler
to infer the underlying clustering of a set of data points
assumed to have been generated by a Dirichlet process mixture
model. I have created a set of data points either in matlab format or
in raw text format.
Along with the (x,y) coordinates of each point is a label
indicating the cluster that generated the point. Here are
the data:
Running the sampler involves first assigning each customer (data point) to a table (cluster). Then you'll pick random customers, remove them from the restaurant, and draw from the CRP posterior to pick a new table for them. For both the initial assignment and the re-assignment, the posterior probability of assigning a customer to a table is proportional to product of (1) the CRP prior, which is based on table occupancies and α, and (2) the likelihood of the observed (x,y) value given estimated parameters for each table.
Several points of advice:
(1) For a customer assigned to a new table, you'll have to compute a likelihood of their observed (x,y) value. To handle this case, I drew parameters for the new (empty) table from the prior distribution G0, which yields a likelihood that is dependent on the randomly drawn cluster center from the customer's (x,y) value.
(2) In class, we discussed resampling the table assignments. But you'll also have to resample the table parameters (the cluster centers). There are two ways to do this:
The implementation requires a lot of bookkeeping. Using the maximum a posteriori parameter estimates, each time a customer is removed from the restaurant for reassignment, you'll want to recompute the parameter values associated with that customer's former table, and similarly each time a customer is added to a table. You'll also have to deal with the fact that as customers shift around, occupied tables can become unoccupied. Unoccupied tables must be deleted. The CRP should allow only one unoccupied table at a time.
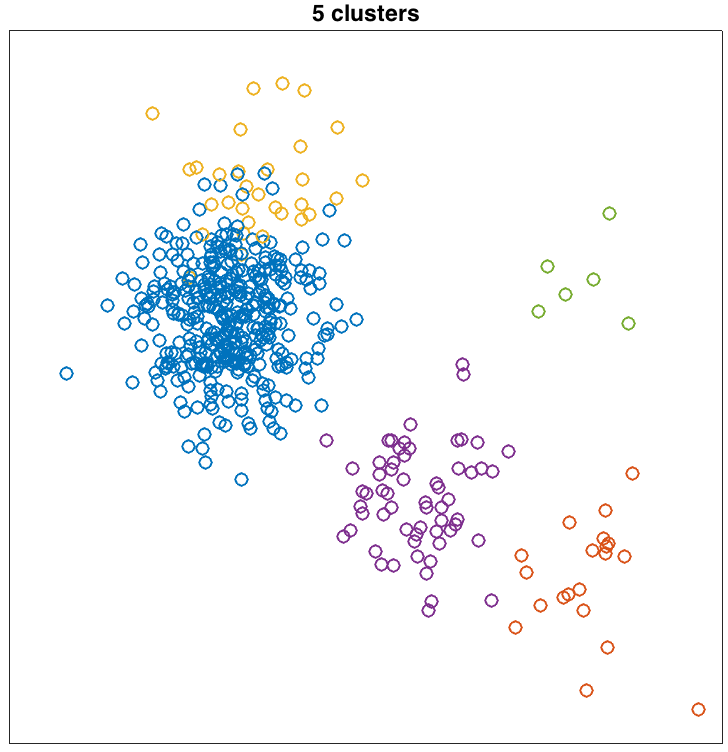
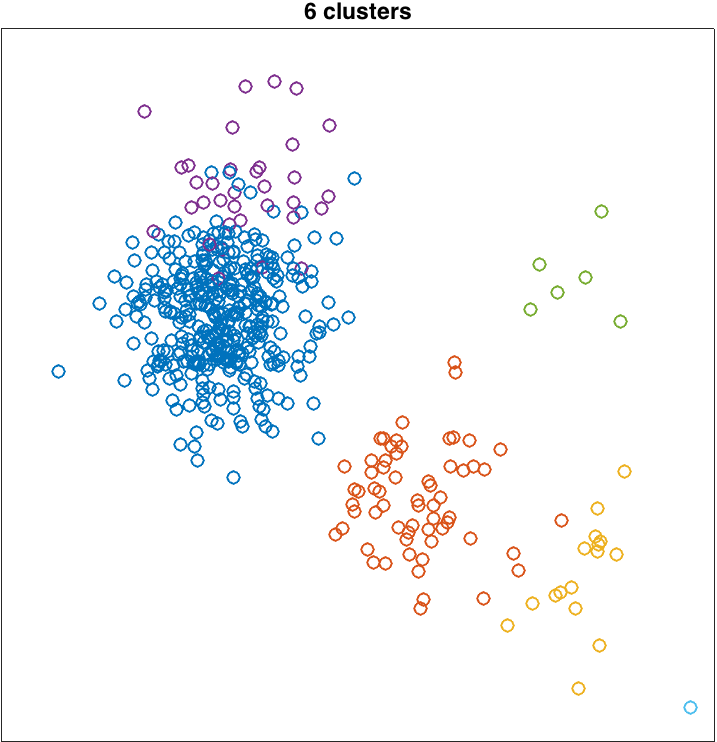
Here are two examples of inferred clusters which I obtained by running the sampler for 100 updates of each customer's table assignment. The example on the left is pretty good; the example on the right is not great.
Running the sampler involves first assigning each customer (data point) to a table (cluster). Then you'll pick random customers, remove them from the restaurant, and draw from the CRP posterior to pick a new table for them. For both the initial assignment and the re-assignment, the posterior probability of assigning a customer to a table is proportional to product of (1) the CRP prior, which is based on table occupancies and α, and (2) the likelihood of the observed (x,y) value given estimated parameters for each table.
Several points of advice:
(1) For a customer assigned to a new table, you'll have to compute a likelihood of their observed (x,y) value. To handle this case, I drew parameters for the new (empty) table from the prior distribution G0, which yields a likelihood that is dependent on the randomly drawn cluster center from the customer's (x,y) value.
(2) In class, we discussed resampling the table assignments. But you'll also have to resample the table parameters (the cluster centers). There are two ways to do this:
- use Gibbs sampling: the posterior conditioned on all the table assignments turns out to be pretty simple given the way I set up the generative model. It is a Gaussian distribution centered on the mean (x,y) of all customers at the table, with σ = 0.1.
- use the maximum a posteriori estimate, which is just the mean (x,y) of all customers at the table
The implementation requires a lot of bookkeeping. Using the maximum a posteriori parameter estimates, each time a customer is removed from the restaurant for reassignment, you'll want to recompute the parameter values associated with that customer's former table, and similarly each time a customer is added to a table. You'll also have to deal with the fact that as customers shift around, occupied tables can become unoccupied. Unoccupied tables must be deleted. The CRP should allow only one unoccupied table at a time.
Here are two examples of inferred clusters which I obtained by running the sampler for 100 updates of each customer's table assignment. The example on the left is pretty good; the example on the right is not great.